This is day 7 of "One CSV, 30 stories":http://blog.whatfettle.com/2014/10/13/one-csv-thirty-stories/ a series of articles exploring "price paid data":https://www.gov.uk/government/statistical-data-sets/price-paid-data-downloads from the Land Registry found on GOV.UK. The code for this and the other articles is available as open source from "GitHub":https://github.com/psd/price-paid-data
Continuing on from "yesterday's":http://blog.whatfettle.com/2014/10/19/one-csv-thirty-stories-6-prices/ foray into prices, today sees more of the same with more or less the same "gnuplot":http://gnuplot.sourceforge.net/ script.
The prices file from "Day 2":http://blog.whatfettle.com/2014/10/15/one-csv-thirty-stories-2-counting-things/ contains almost 150,000 different prices:
bc. $ wc -l price.tsv
141464
| Count | Price (£) |
|---|---|
| 208199 | 250000 |
| 185912 | 125000 |
| 163323 | 120000 |
| 159519 | 60000 |
| 147645 | 110000 |
| 145214 | 150000 |
| 140833 | 115000 |
| 134731 | 135000 |
| 131334 | 175000 |
| 131223 | 85000 |
| 129597 | 130000 |
| 129336 | 105000 |
| 126161 | 165000 |
| 126004 | 95000 |
| 124379 | 145000 |
| 123968 | 75000 |
| 123893 | 140000 |
| 123451 | 160000 |
| 123340 | 90000 |
| 120306 | 100000 |
| 119776 | 80000 |
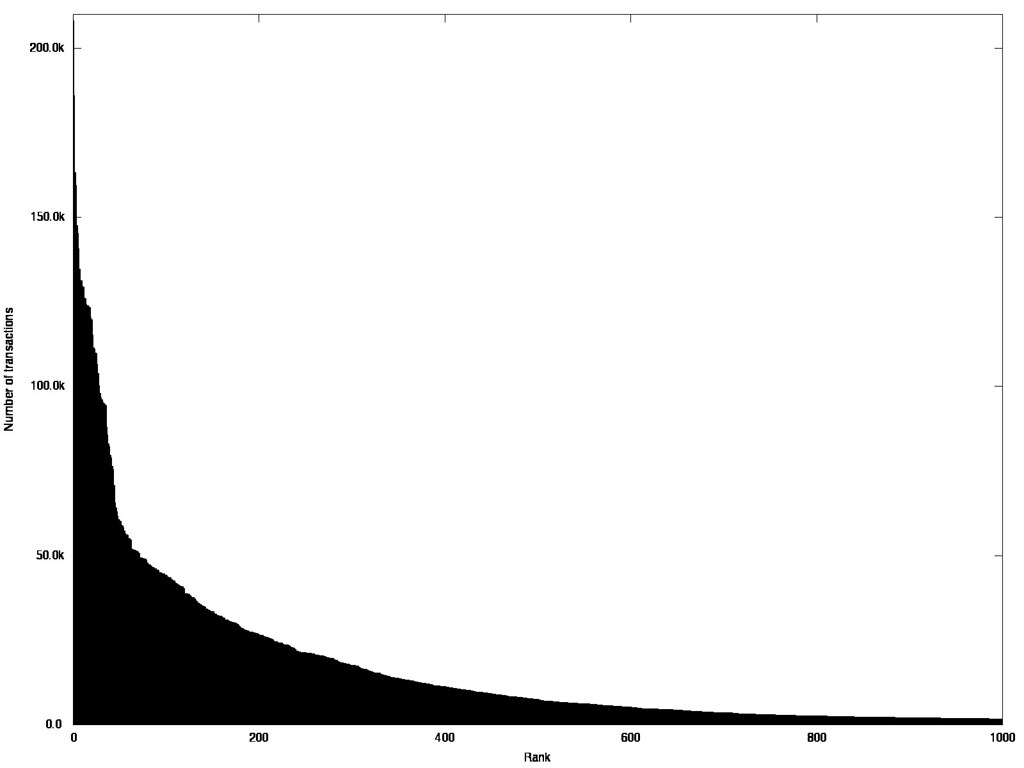
which when plotted by rank using the "gnuplot pseudo-column zero":http://gnuplot.sourceforge.net/docs_4.2/node133.html :
bc. plot "/dev/stdin" using 0:1 with boxes lc rgb "black"
shows how the prices are distributed in quite a steep power-curve, a "long-tail":http://en.wikipedia.org/wiki/Long_tail if you will:
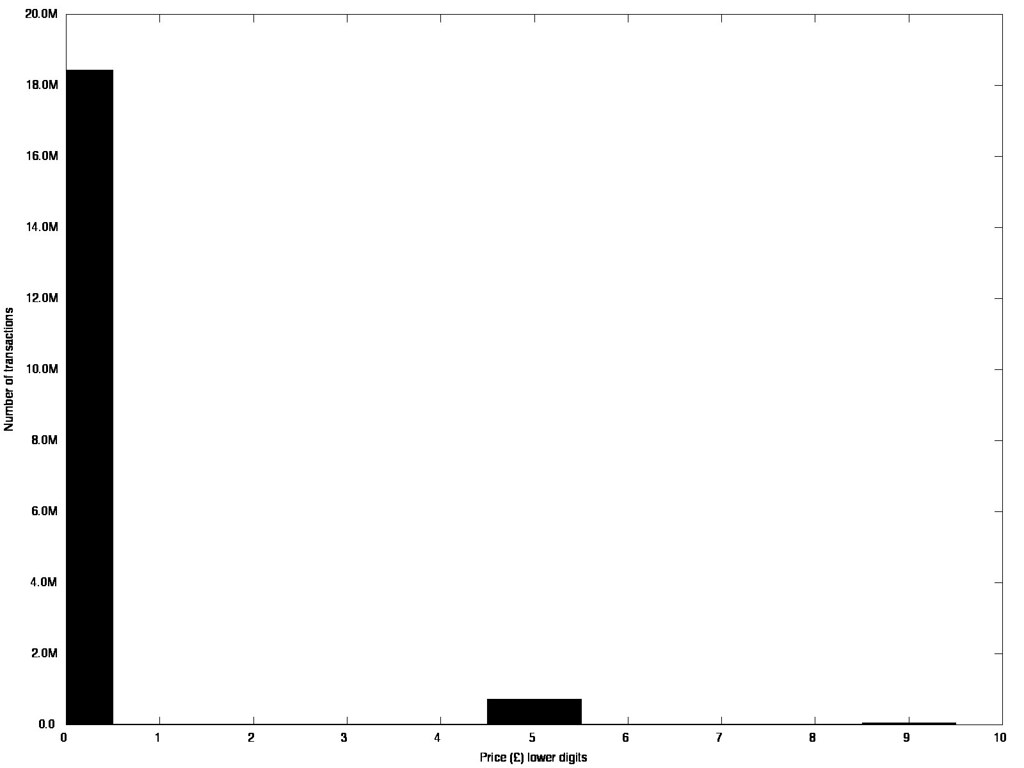
A quick awk script to collate prices, modulo 10:
bc. cut -f1 < data/pp.tsv | awk '{ print $1 % 10 }' | sort | uniq -c | sort -rn gives us the distribution of the last digit in the prices:
| Count | Price (£1) |
|---|---|
| 18437019 | 0 |
| 715633 | 5 |
| 56195 | 9 |
| 21890 | 2 |
| 17549 | 6 |
| 17395 | 3 |
| 16889 | 1 |
| 16235 | 7 |
| 14888 | 8 |
| 11878 | 4 |
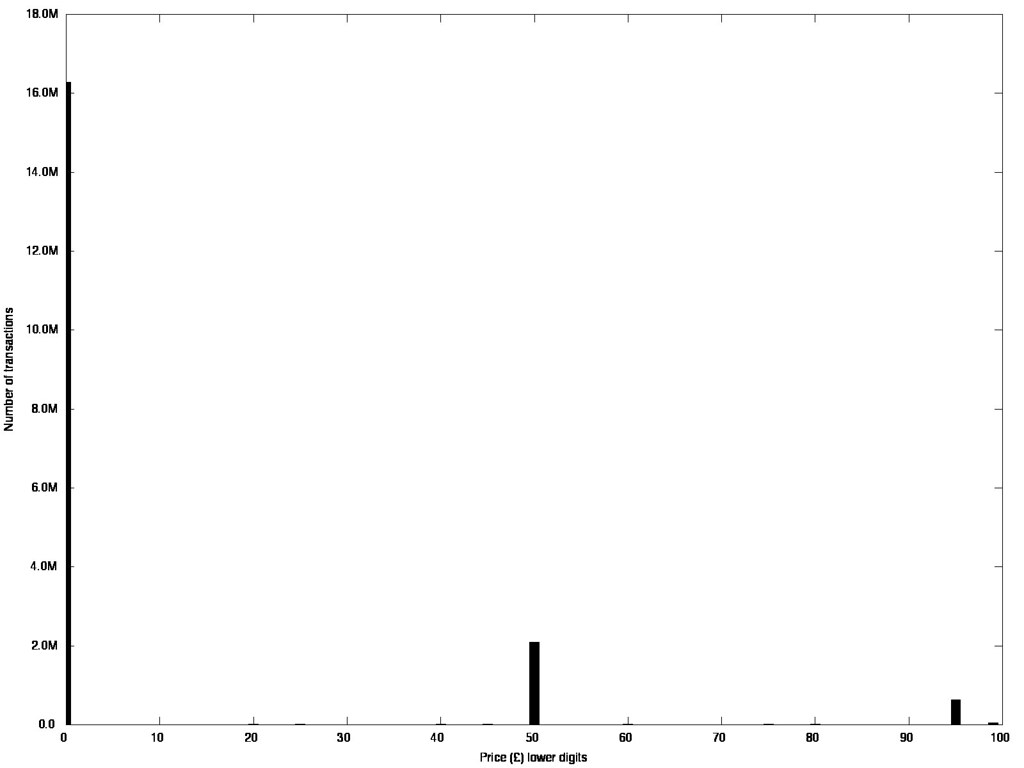
and can be tweaked to show the last two digits:
| Count | Price (£10) |
|---|---|
| 16282411 | 0 |
| 2087949 | 50 |
| 636253 | 95 |
| 45710 | 99 |
| 22419 | 75 |
| 20194 | 25 |
| 11271 | 45 |
| 11121 | 60 |
| 9890 | 20 |
| 9425 | 80 |
| 9235 | 40 |
| 7677 | 90 |
| 6855 | 70 |
| 6532 | 10 |
| 6519 | 55 |
| 5924 | 30 |
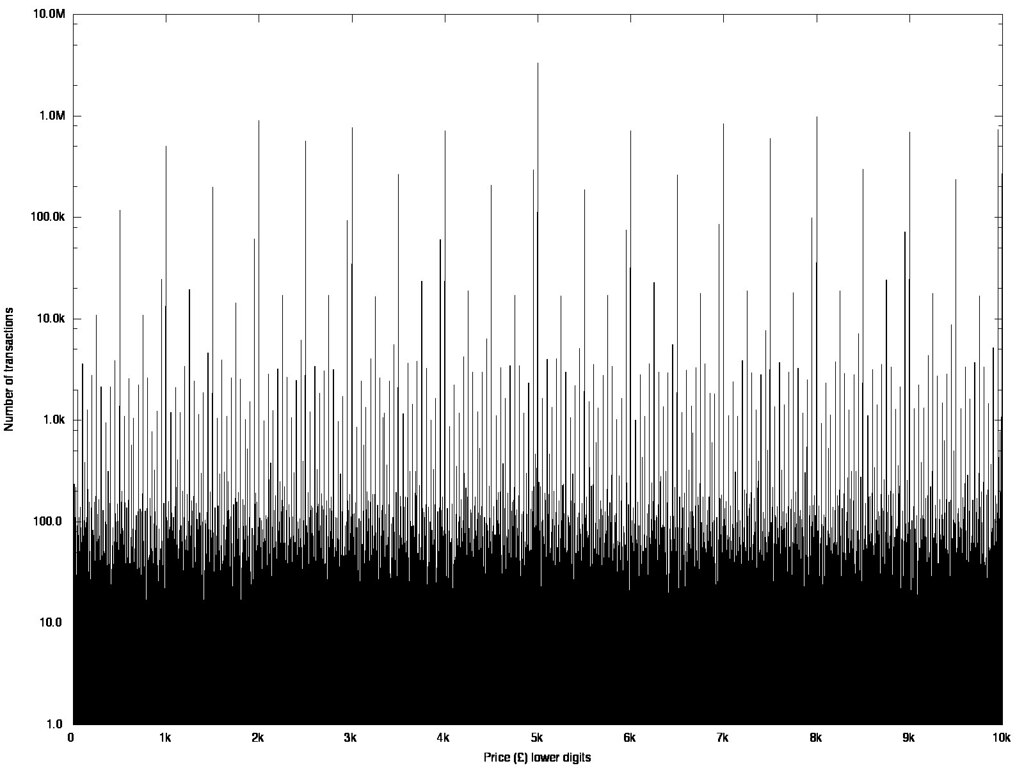
and the last three digits in the prices:
| Count | Price (£100) |
|---|---|
| 3682320 | 0 |
| 3332503 | 5000 |
| 980975 | 8000 |
| 897786 | 2000 |
| 835579 | 7000 |
| 765799 | 3000 |
| 732587 | 9950 |
| 713121 | 6000 |
| 707063 | 4000 |
| 687129 | 9000 |
| 596687 | 7500 |
| 567882 | 2500 |
| 503076 | 1000 |
| 298398 | 8500 |
| 294878 | 4950 |
| 267618 | 9995 |
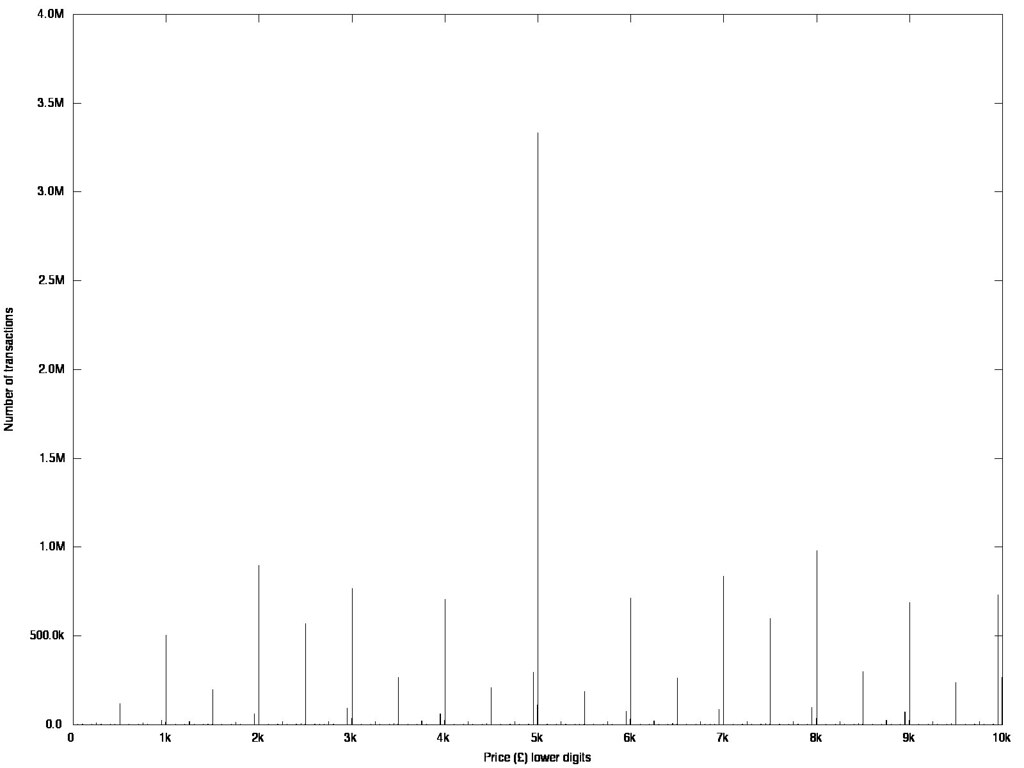
A logarithmic scale can help see patterns in the lower values whilst showing the peaks on the same page; it's a bit like squinting at the chart from a low angle:
I think tomorrow will be "pretty average":http://blog.whatfettle.com/2014/10/25/one-csv-thirty-stories-8-heatmap-meh/.