This is day 10 of "One CSV, 30 stories":http://blog.whatfettle.com/2014/10/13/one-csv-thirty-stories/ a series of articles exploring "price paid data":https://www.gov.uk/government/statistical-data-sets/price-paid-data-downloads from the Land Registry found on GOV.UK. The code for this and the other articles is available as open source from "GitHub":https://github.com/psd/price-paid-data
It's been a few days since "yesterday's post":http://blog.whatfettle.com/2014/10/28/one-csv-thirty-stories-9-yearly/ in part because I've been away canal boating without much access to the Internet, but mostly because I spent the time I had literally off in the weeds. It seems I frittered what little time I had for this project exploring statistical techniques to try and make more sense of the prices.
A week away has also put me in something a reflective mood. Playing with statistics reminded me of my time as a University placement student working in an "operational research":http://en.wikipedia.org/wiki/Operations_research team at "ICI":http://en.wikipedia.org/wiki/Imperial_Chemical_Industries in the 1980s. I learnt a lot of things during that year sharing an office with an elderly statistician†, but above all else, how statistics is an art form in that art is required to use statistics to tell stories.

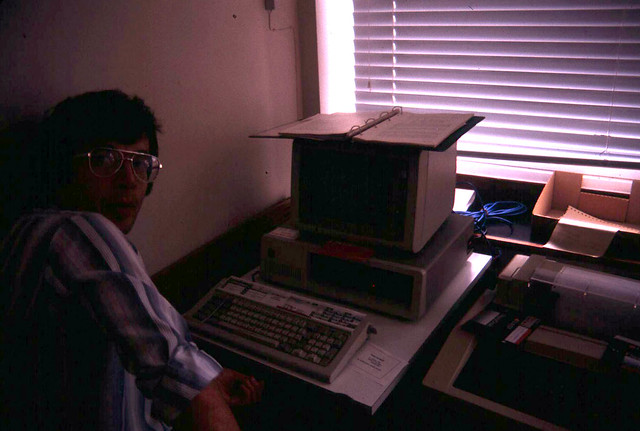
Something else I've carried with me came directly from my boss at the time, Mike Taylor. I really couldn't have asked for a better sponsor for my "industrial training", someone who really understood the value of using a multiplicity of tools, instilling into me the Marshall McLuhan insight how we shape tools which shape how we think. Mike set me loose on quite a few problems experienced by quite a variety of users, and encouraged to tackle each of them with a different programming language or environment, many of which no longer exist or have much of a footprint on the Web. But it was APL which really captured my imagination. Here's a picture of Mike in front of his IBM XT, with its APL keyboard and printer:
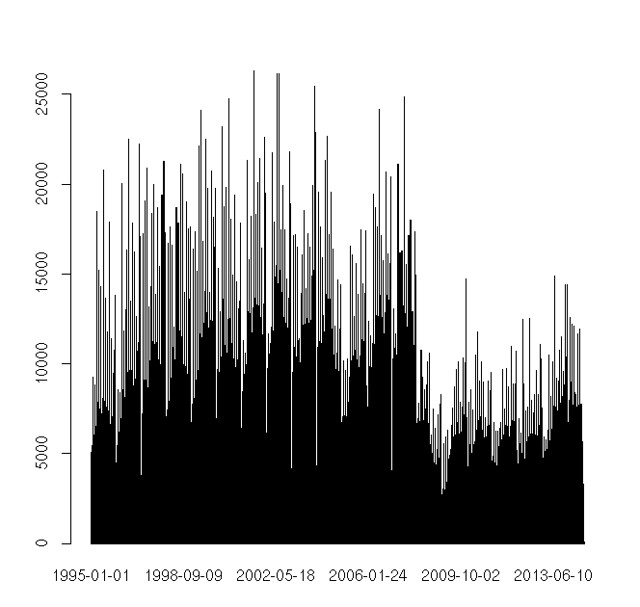
Given my fond memories of this era building small systems in Prolog, Smalltalk, SAVOIR and SAS, and establishing a long love of APL, I'm rather surprised to be finding R heavy going, especially given how quick and easy it was to generate an interesting perspective on our prices:
bc. prices <- read.csv("data/prices.tsv", sep="⋯")
plot(prices[,1])
R is after all just yet another workspace environment with great matrix manipulation, so what's not to like? Well whilst interactive environments are great for experimentation and a "REPL":http://en.wikipedia.org/wiki/Read%E2%80%93eval%E2%80%93print_loop is almost essential for learning a new programming language, my aesthetic is definitely for small pieces, loosely joined and it's hard to fit workspaces into the Unix pipeline. It is, however possible to create R scripts using the following shebang:
bc. #!/usr/bin/env r --slave -f
and whilst we can easily generate plots as images:
bc. png("out/pricesmooth.png", width=640, height=480)
I've had little luck dealing with files from standard input even when using a filename of @/dev/stdin@, though it is possible to generate images to standard output:
bc. png("/dev/stdout", width=640, height=480)
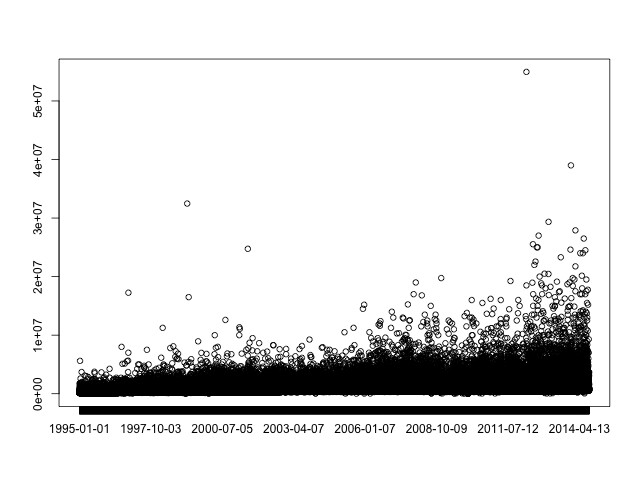
The R scatter plot is almost as fast to render as our original postscript version from "Day 4":http://blog.whatfettle.com/2014/10/17/one-csv-thirty-stories-4-scattering/:
bc. plot(prices[,1], prices[,2])
Of course the reason to use a package like R is it provides code to analyse the data, such as fitting a "Local regression (LOESS)":http://en.wikipedia.org/wiki/Local_regression curve:
bc. scatter.smooth(prices[,1], prices[,2], degree=2, col="#C8C8C8", span=0.5)
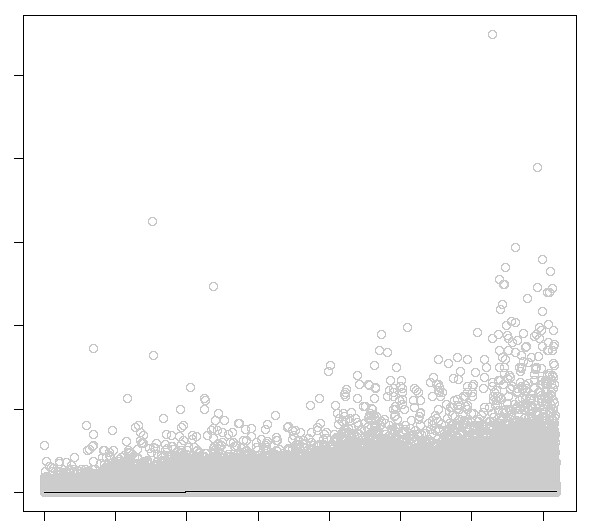
Cropping the plot to figures below £600,000 makes that flat line a little more informative:
bc. scatter.smooth(prices[,1], prices[,2], degree=2, col="#c8c8c8", span=0.5, ylim=c(0, 600000))
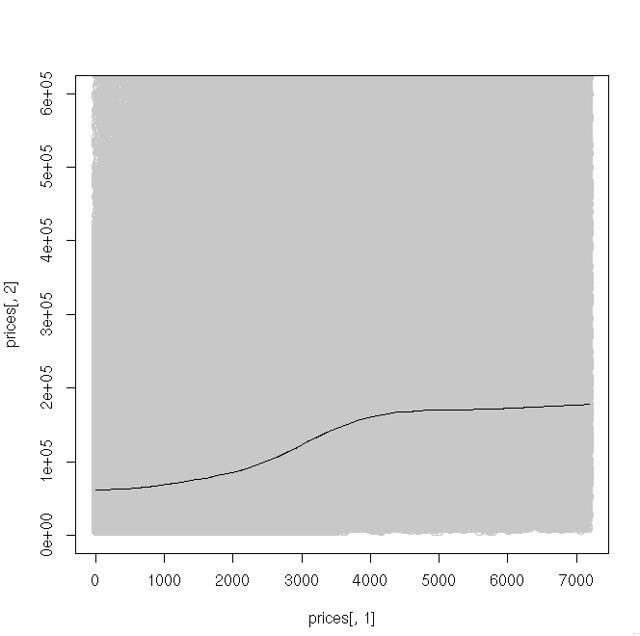
Basically this shows prices rising gradually with a steeper build up before 2009. I could spend time "tomorrow":http://blog.whatfettle.com/2014/11/02/one-csv-thirty-stories-11-calendar/ improving this plot, but first I think I need to grab some of the low-hanging fruit to overcome my now 8 post deficit.
†I'm now bothered by that memory of her because my time spent with Pam was brilliant and I think I'm now close to her age when we shared an office.