This is day 16 of "One CSV, 30 stories":http://blog.whatfettle.com/2014/10/13/one-csv-thirty-stories/ a series of articles exploring "price paid data":https://www.gov.uk/government/statistical-data-sets/price-paid-data-downloads from the Land Registry found on GOV.UK. The code for this and the other articles is available as open source from "GitHub":https://github.com/psd/price-paid-data
"Yesterday":http://blog.whatfettle.com/2014/11/07/one-csv-thirty-stories-15-hotspots/ we made a map with the total volume of transactions over 20 years. I wanted to see how that distribution changed over time. A spot of knife-and-forking:
bc. cut -d'⋯' -f2,3 data/pp.tsv |
sed -e 's/ //' |
awk '$2' |
sort |
uniq -c |
sort -rn |
sed -e 's/^ *//' -e 's/ */⋯/' -e 's/ *$//'
sort -k2 > daily-postcodes.tsv
gives a count of the number of transactions for each postcode on each date:
bc. 1⋯1995-01-01⋯B297NS
1⋯1995-01-01⋯B315DF
1⋯1995-01-01⋯B458LY
1⋯1995-01-01⋯BB99RQ
1⋯1995-01-01⋯BS110JH
1⋯1995-01-01⋯BS16XF
1⋯1995-01-01⋯BS81BY
1⋯1995-01-01⋯CA119JD
1⋯1995-01-01⋯CO70BZ
1⋯1995-01-01⋯CR35SU
...
To make a version of the map, one for each of the days in the price-paid dataset requires an awfully large number of postcode lookups. Rather than sorting and merging individual files 7181 times I elected to write some code to read the OS OpenData™ Code-Point® into a Perl hash table:
bc. my $geocodes = "data/codepo_gb.tsv";
my %postcode = ();
open my $file, "<", $geocodes or die "unable to open $geocodes";
while (my $line = <$file>) {
my ($postcode, $easting, $northing) = split /\t/, $line;
$postcode{$postcode} = { easting => $easting, northing => $northing };
}
Which we can use to look-up the easting and northing to draw a circle for each postcode:
bc. my $c = $postcode{$p->{postcode}};
my $x = $width * $c->{easting} / $max_easting;
my $y = $height - ($height * $c->{northing} / $max_northing);
my $size = $p->{count};
printf($fp "circle %d,%d,%d,%d\n", $x, $y, $x+$size, $y+$size);
The complete script generates an individual image for each day, here's the 365 images for 2007:
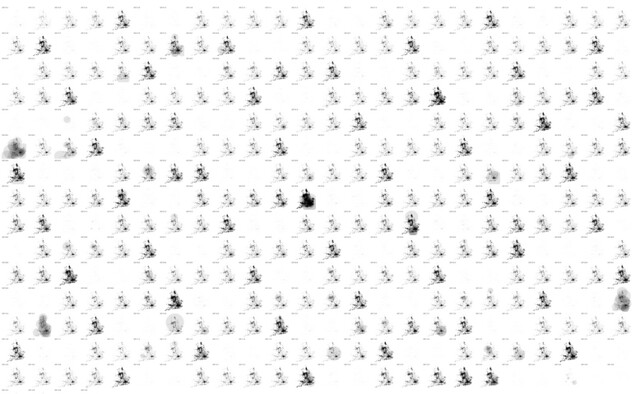
Stringing these individual images using "gifsicle":http://www.lcdf.org/gifsicle/man.html gives a rather large animated gif:

If you are minded, you can upload these to "gifprint.com":http://gifprint.com/ to make a flip book. A partial success:
The daily images are quite noisy and should benefit from some polishing, so more iteration on this hack "tomorrow":http://blog.whatfettle.com/2014/11/17/one-csv-thirty-stories-17-scattermap-calendar/.