This is day 18 of "One CSV, 30 stories":http://blog.whatfettle.com/2014/10/13/one-csv-thirty-stories/ a series of articles exploring "price paid data":https://www.gov.uk/government/statistical-data-sets/price-paid-data-downloads from the Land Registry found on GOV.UK. The code for this and the other articles is available as open source from "GitHub":https://github.com/psd/price-paid-data
Following on from "yesterday":http://blog.whatfettle.com/2014/11/17/one-csv-thirty-stories-17-scattermap-calendar/ I wanted to create a "choropleth map":http://en.wikipedia.org/wiki/Choropleth_map to show how prices are distributed across the country. A number of people have constructed shapefiles for postcodes which can be used in "d3":https://github.com/roblascelles/uk-postcode-map/wiki/Displaying-the-data but as discussed on "day 13":http://blog.whatfettle.com/2014/11/06/one-csv-thirty-stories-13-postcodes/ the licensing of this data isn't clear.
So I wrote a small "Perl script":https://github.com/psd/price-paid-data/blob/master/bin/pricegrid.pl to use the points in the "OS OpenData™ Code-Point® Open":http://www.ordnancesurvey.co.uk/business-and-government/products/opendata-products.html dataset to place each price into one of 1024 squares on a 32x32 grid, then a used a small "PHP template":https://github.com/psd/price-paid-data/blob/master/bin/pricegrid.php to present the average price of each square as a coloured grid on an HTML page. Re-running the script for each year also shows how property prices have heated up over time:
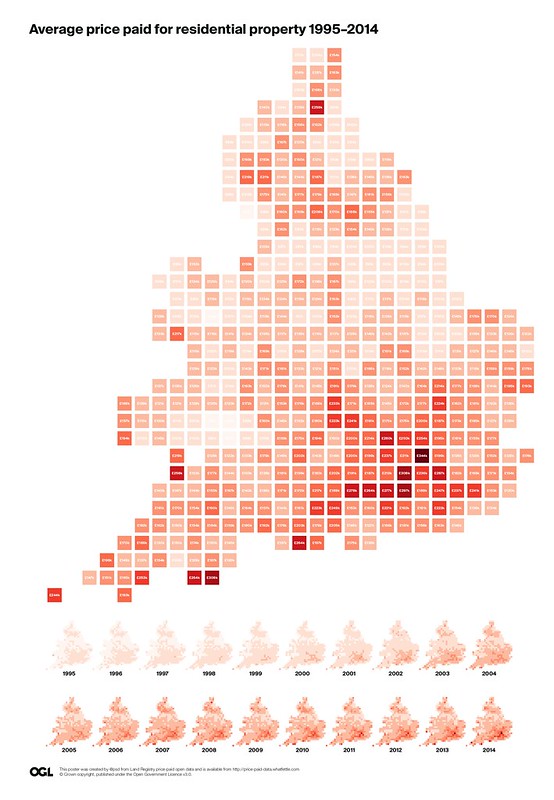
["PDF":https://github.com/psd/price-paid-data/blob/master/posters/pricegrid.pdf]
A choropleth map made without a map. I've an idea about iterating on this hack for "tomorrow":http://blog.whatfettle.com/2014/11/25/one-csv-thirty-stories-19-bubblepleth/.