This is day 11 of "One CSV, 30 stories":http://blog.whatfettle.com/2014/10/13/one-csv-thirty-stories/ a series of articles exploring "price paid data":https://www.gov.uk/government/statistical-data-sets/price-paid-data-downloads from the Land Registry found on GOV.UK. The code for this and the other articles is available as open source from "GitHub":https://github.com/psd/price-paid-data
"Yesterday":http://blog.whatfettle.com/2014/11/01/one-csv-30-stories-10-loess-curve/ I confessed to being blocked exploring the distribution of prices, so today I'm going to return to looking at the distribution of transactions over time. Whilst the histograms on "day 9":http://blog.whatfettle.com/2014/10/28/one-csv-thirty-stories-9-yearly/ were interesting, they didn't reveal much about busiest days of the week, or months of the year. A good way to see such patterns is with a calendar.
Whilst it's possible to code "a heatmap calendar in R":http://stackoverflow.com/questions/15014595/how-to-use-black-and-white-fill-patterns-instead-of-color-coding-on-calendar-hea, I think it's time we moved away from generating images to creating Web pages. "Mike Bostock":http://bost.ocks.org/mike/ has an "extensive gallery":https://github.com/mbostock/d3/wiki/Gallery of example visualisations for his "d3":http://d3js.org/ JavaScript library which includes a "heatmap calendar":http://bl.ocks.org/mbostock/4063318.
I "tweaked this example":https://github.com/psd/price-paid-data/commit/1496e79496ef3a5cd13bb94e41ede15b1fea5ca0 to parse the "date.tsv":https://github.com/psd/price-paid-data/blob/master/data/date.tsv we made on "day 2":http://blog.whatfettle.com/2014/10/15/one-csv-thirty-stories-2-counting-things/ and "played with the colours":https://github.com/psd/price-paid-data/commit/380a9a278972fb0495e10e5e14f2835a0b30d480 giving a calendar of twenty years of transactions:
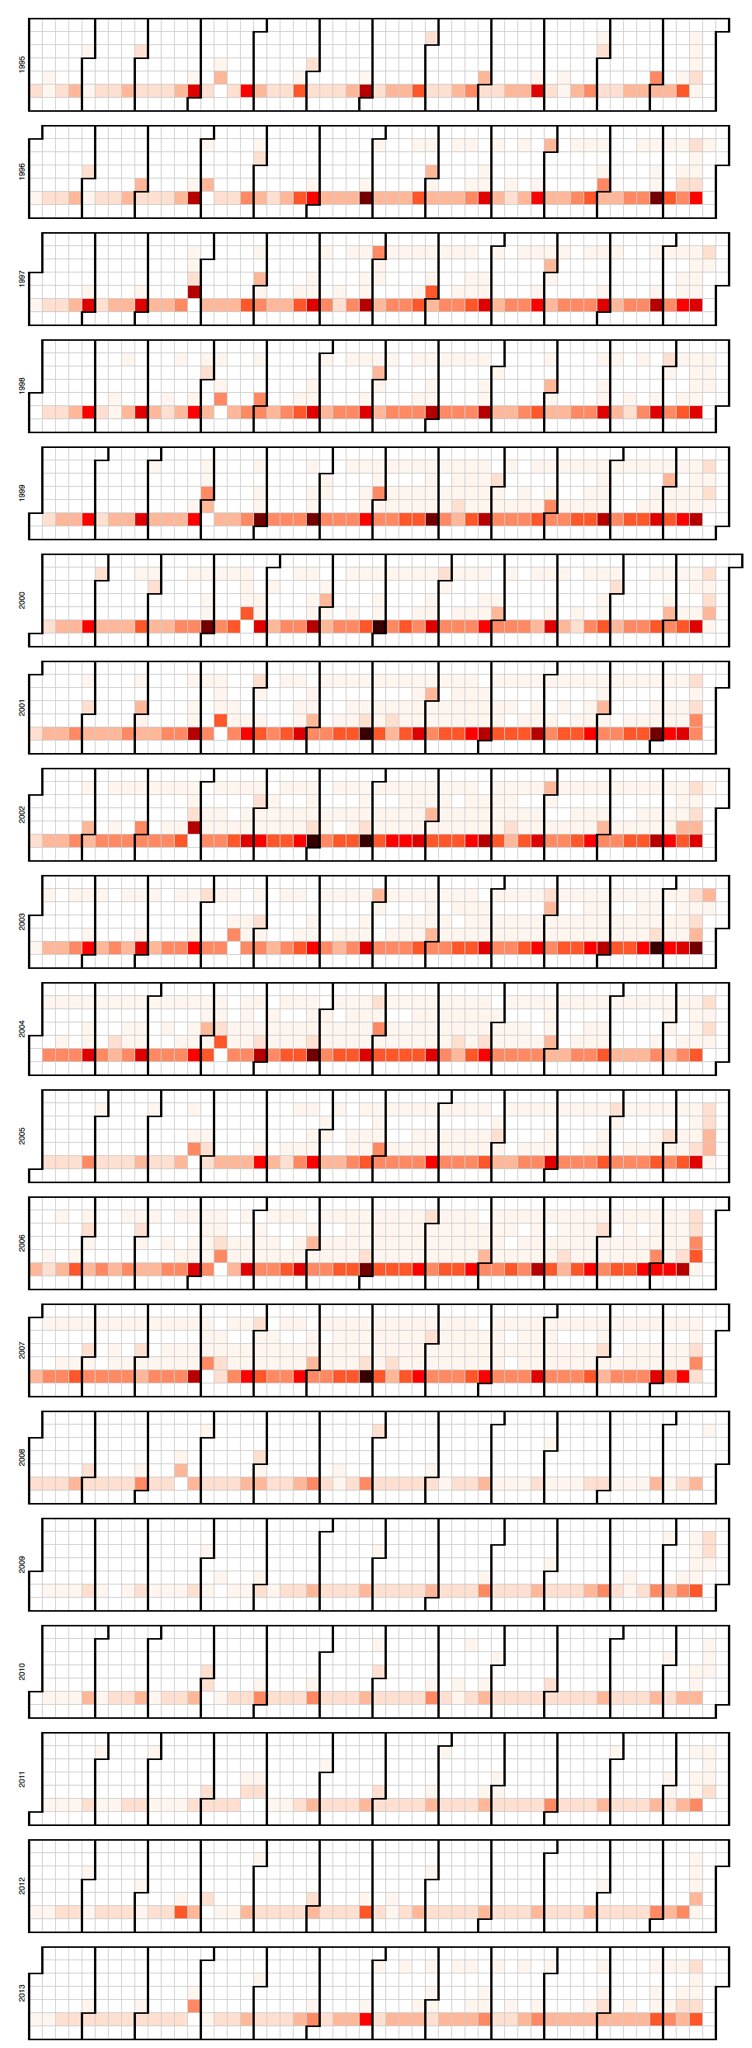
The calendar has Sunday as the first and Saturday as the last day of the week, highlighting Fridays as the busiest day of the week, and the last Friday being the busiest day in a month. And I quite like how you can see which Fridays are Good Fridays. The year is busiest from Summer to Christmas, and once again we can see the fall in volumes following the crash of 2008.
As quick as this hack was to make (it took me less than an hour), it seems like a poor use of SVG and client-side JavaScript where some nicely marked-up, accessible HTML would do. I may return to this hack later, but probably not "tomorrow":http://blog.whatfettle.com/2014/11/04/one-csv-thirty-stories-12-stacked/.