This is day 17 of "One CSV, 30 stories":http://blog.whatfettle.com/2014/10/13/one-csv-thirty-stories/ a series of articles exploring "price paid data":https://www.gov.uk/government/statistical-data-sets/price-paid-data-downloads from the Land Registry found on GOV.UK. The code for this and the other articles is available as open source from "GitHub":https://github.com/psd/price-paid-data
The "previous post":http://blog.whatfettle.com/2014/11/11/one-csv-thirty-stories-16-mapination/ resulted in a scatter map of the property transactions in the price-paid dataset. Having made the images, I thought it would be a simple matter to string them into a single page to make a calendar of transactions per-postcode for each day.
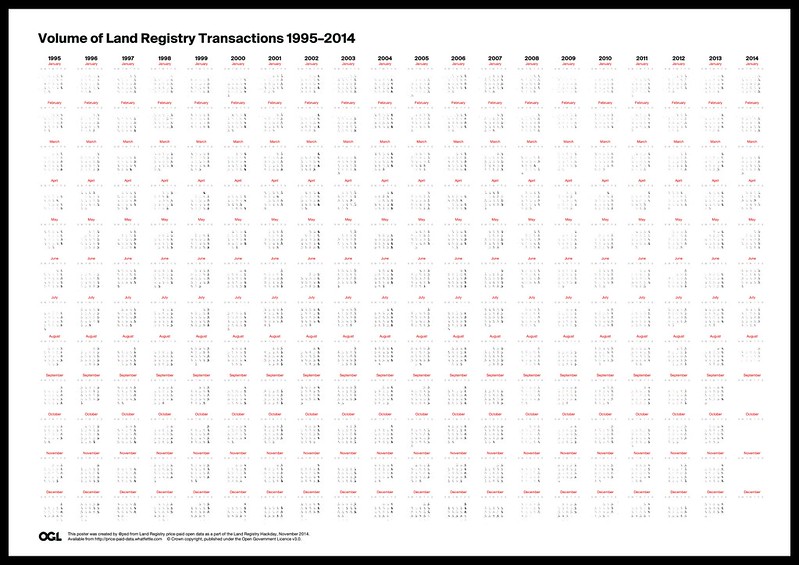
["75MB A1 PDF":https://github.com/psd/price-paid-data/blob/master/posters/scattermap-calendar.pdf]
It turned out the plot took me a lot longer to develop than expected. As much as I like this poster, in particular the techniques used for its production, I am now several days older and a more than a little wiser.
I should start by thanking everyone who completed my "short, anonymous survey":http://tinyurl.com/1csv-30stories-survey or "contacted me":http://blog.whatfettle.com/about/ about the series thus far. I'll incorporate people's suggestions into the hacks and give a wrap-up of the survey in the final post. Your feedback is really helping keep me motivated, even when I've been blocked, and guilt-tripping me into not kittening and dropping this project in favour of shiny new ventures, or indeed playing with our new kittens.

One actionable suggestion came from my brilliant colleague, "Anna":http://anna.ps, who nudged me to change the scatter maps from plotting the radius to the area. That was a simple matter of using the square-root of the value when scaling the circle for each postcode, and removed some of the splodgy outliers in the daily plots.
A question a number of people have asked is what happens when the Land Registry realise more data in a month or so's time? All of the hacks thus far have been built using a "Makefile":https://github.com/psd/price-paid-data/blob/master/Makefile which downloads the dataset from GOV.UK, re-runs all of the scripts and recreates all the images. All apart from the hackday posters, which "Michael":https://twitter.com/mikiee_t built by hand, applying his lovely design fu in Adobe InDesign. Whilst it might be possible to script and automate InDesign, I'm disinclined to have to fathom how to manage Adobe software licences on my machine, and it doesn't help others who can't afford such luxuries as professional publishing tools.
So I turned to recreating the posters as HTML, and used the browser to design and composite the page. There are a lot of different ways of generating HTML from our data, but I wanted to use a "templating language":http://en.wikipedia.org/wiki/Comparison_of_web_template_engines for which there's again a lot of options. I wrote a "PHP script":https://github.com/psd/price-paid-data/blob/master/bin/scattermap-calendar.php, mostly because selecting something like Ruby or Python means using yet another language for the templating, but mostly because PHP is ubiquitous. There's a certain amount of snobbery about PHP, but I've no truck for such snark. PHP is the Web's BASIC. It's everywhere, beginner-friendly, and I like it.
This approach seemed hopeful, but then I hit an issue. Chrome in particular struggled, flaking out where there were more than 5,000 images on a page. I experimented with ways of reducing the number of individual files, including making a single, massive image file, and only showing weekdays, but neither really helped. So I turned to tiling the images, and displaying a portion of each image in each square using CSS sprites. This is where much of my time was lost. Front-end development remains a tricky craft, and creating a page of 7,034 tiles on a grid using responsive images was a bit of a faff. Getting these images to scale and inside table cells was beyond my skill. I really should have grabbed one of my many front-end specialist friends to help, but after a Swan load of failed attempts, I landed on something that worked: a series of divs, each with a spacer image:
bc. .day {
float: left;
overflow: hidden;
height: 5mm;
max-width: 5mm;
}
...
...
Finally, printing such a large page reliably crashed Chrome. Fortunately the "wkhtmltopdf":http://wkhtmltopdf.org/ command can be used to generate a PDF from HTML, works reliably for our page and can be driven from a Makefile:
bc. posters/scattermap-calendar.pdf: html/scattermap-calendar.html
wkhtmltopdf -q --page-size a1 --orientation landscape html/scattermap-calendar.html $@
I have to continue to learn how to deal with getting stuck like this if I'm to regain any kind of momentum on this venture. Let's see how well I do "tomorrow":http://blog.whatfettle.com/2014/11/20/one-csv-thirty-stories-18-choropleth/.